Visit Open-E website
Results 1 to 9 of 9

Thread: Open-E DSS performance

Hybrid View

Previous Post Previous Post   Next Post Next Post
  1. #1

    Default Open-E DSS performance

    Hi All,

    Currently I am running an Open-E system in testing mode as storage for the XenServer nodes. The current performance of the system bugs me a little, I am very curious to understand what are causing these non-optimal performance results. Or maybe the results are fine, I do not know and would like a second opinion.

    The storage server setup
    Dell R510
    8 GB DDR3 1333 MHZ RAM
    12x 300 GB SAS in RAID 10
    PERC H700 controller, 1 gb cache, write back enabled
    4x Intel PRO 1000 MBIT NIC

    Network
    HP Procurve 2510 as storage switch
    Storage server is connected with 3x 1 gbit in LACP (802.3ad) trunk.
    XenServer node is connected with 2x 1 gbit in LACP (802.3ad) trunk
    Jumbo 9K frames enabled

    From within a VM (4 cores / 4 GB RAM) in XenServer, I run the following dd command to execute a low-level data copy:

    Code:
    dd if=/dev/zero of=/var/tmpMnt bs=1024 count=12000000
    Which returns:

    Code:
    12000000+0 records in
    12000000+0 records out
    12288000000 bytes (12 GB) copied, 109.673 seconds, 112 MB/s
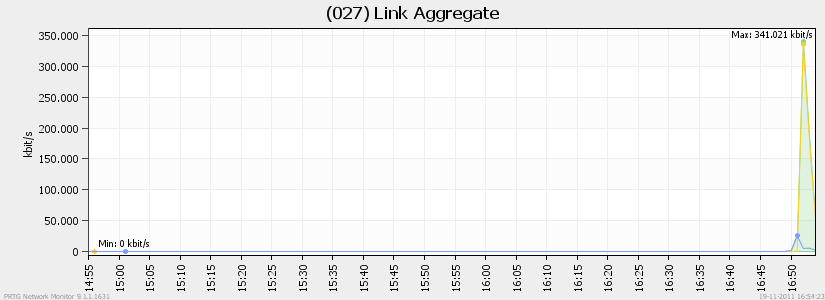
    I suppose some of the speed can be cache on the raid controller. However, when looking on the switch via SNMP, the traffic that flows during the copy action.. 400 mbit (see below). It isn't even close to the 2 gbit that (looking from the nodes perspective) I should have available.


    Is this a lack in performance, should I be able to achieve more? Is this a configuration fault?

    Any tips / advise would be appreciated.

  2. #2

    Default

    Update with VMWare:

    The following benchmarks have been achieved with VMWare (preferable hypervisor). I still have some questions concerning the seeks/s that have been achieved. Current (network) setup is 1x 1 GB from storage to switch and 1x 1GB from host to switch.

    Benchmark specs:

    Code:
    [root@localhost ~]#  dd if=/dev/zero of=/var/tmpMnt bs=1024 count=12000000
    12000000+0 records in
    12000000+0 records out
    12288000000 bytes (12 GB) copied, 100.451 seconds, 122 MB/s
    Code:
    [root@localhost ~]# ./seeker /dev/sda
    Seeker v2.0, 2007-01-15, http://www.linuxinsight.com/how_fast_is_your_disk.html
    Benchmarking /dev/sda [51200MB], wait 30 seconds..............................
    Results: 386 seeks/second, 2.59 ms random access time
    Code:
     
    [root@localhost ~]# hdparm -Tt /dev/sda
    /dev/sda:
     Timing cached reads:   22744 MB in  2.00 seconds = 11395.36 MB/sec
     Timing buffered disk reads:  276 MB in  3.01 seconds =  91.78 MB/sec

  3. #3
    Join Date
    Oct 2010
    Location
    GA
    Posts
    935

    Default

    in your original post, have you tried to use MPIO instead of the bond?

    in your second post, what are the details of the RAID.... controller, raid type, drive specs, etc...

  4. #4

    Default

    Quote Originally Posted by Gr-R
    in your original post, have you tried to use MPIO instead of the bond?

    in your second post, what are the details of the RAID.... controller, raid type, drive specs, etc...
    I have not tried MPIO, the article on MPIO is for vSphere 4, needs some customizations for 5, I am currently gathering them and getting them ready to mail to Open-E for an article on 5.

    In the second post the same setup (hardware based) is being used so:

    12x 300 GB SAS (ST3300657SS) in RAID 10
    PERC H700 controller, 1 gb cache, write back enabled

  5. #5
    Join Date
    Oct 2010
    Location
    GA
    Posts
    935

    Default

    let us know when you have the MPIO info. my experience tells me MPIO can typically be better then any bond.

    regarding the hardware:
    you posted:
    Results: 386 seeks/second, 2.59 ms random access time

    those drives can do :
    Average latency2.0ms
    Random read seek time3.4ms
    Random write seek time3.9ms

    so not bad really.

    The PERCs dont get updated firmware from LSI very often, i suspect this can be an issue.

  6. #6

    Default

    Update, I managed to get down MPIO. Some new benchmarks, some of them I question (mostly seeker). Besides from the guide, which I got down on vSphere 5, I made all the vSwitches eat Jumbo (9K frames).

    dd command (2x executed with 2 hour gaps:
    Code:
    [root@localhost ~]# dd if=/dev/zero of=/var/tmpMnt bs=1024 count=12000000
    12000000+0 records in
    12000000+0 records out
    12288000000 bytes (12 GB) copied, 74.6241 seconds, 165 MB/s
    
    [root@localhost ~]# dd if=/dev/zero of=/var/tmpMnt bs=1024 count=12000000
    12000000+0 records in
    12000000+0 records out
    12288000000 bytes (12 GB) copied, 73.7074 seconds, 167 MB/s
    seeker:
    Code:
    [root@localhost ~]# ./seeker /dev/sda
    Seeker v2.0, 2007-01-15, http://www.linuxinsight.com/how_fast_is_your_disk.html
    Benchmarking /dev/sda [51200MB], wait 30 seconds..............................
    Results: 912 seeks/second, 1.10 ms random access time
    
    [root@localhost ~]# ./seeker /dev/sda
    Seeker v2.0, 2007-01-15, http://www.linuxinsight.com/how_fast_is_your_disk.html
    Benchmarking /dev/sda [51200MB], wait 30 seconds..............................
    Results: 934 seeks/second, 1.07 ms random access time
    hdparm:
    Code:
     Timing buffered disk reads:  302 MB in  3.01 seconds = 100.50 MB/sec
    I think there still could be some as mentioned here and here.

    Any thoughts?

Posting Permissions

  • You may not post new threads
  • You may not post replies
  • You may not post attachments
  • You may not edit your posts
  •